Research and advocacy of progressive and pragmatic policy ideas.

Indebted Generation: Part 4
Survey Of Student Loan Borrowers’ Views
How are borrowers impacted by student loans? How do they feel about student loans overall? We conclude our research series with illuminating results from a novel survey on Malaysian student loan borrowers.
By Ooi Kok Hin & Edwin Goh27 January 2022
Baca Versi BM
Last year we began a research series to address the quandary of student debt in Malaysia, and recommended some key policy changes towards resolving problems related to outstanding loans as well as longer term systemic solutions.
Part 1 of this research series summarises the issues. Since the establishment of Malaysia’s primary student loan institution PTPTN in 1997, RM62.5 billion in student loans have been issued to 3.5 million borrowers. The success of the system hinges on broad and consistent positive returns to higher education. However, upward social mobility from higher education has not been evenly realised, putting pressure on this policy approach.
In Part 2, we advocated three bold policies to address issues related to current outstanding student debt: targeted partial debt cancellation, income-based repayment, and greater oversight on the workings and financing of PTPTN. Segmenting existing borrowers by their capacity to repay is a key pillar of these recommendations.
In Part 3, we proposed ideas for reforming the way Malaysians finance their higher education. We argued for policymakers to internalise the changing face of higher education and enact policies that evolve with recent trends. This includes diversifying from traditional degrees to TVET and microcredentials, shifting from loans to direct subsidies for students from underprivileged households, and providing individual lifelong education accounts.
In this final instalment, we present findings from our survey of student loan borrowers, which aimed to understand borrowers’ views on student loans and the impact of student loans on their lives. The majority of our survey respondents agreed that their education was worth taking out (and paying off) their student loans, and getting into debt seems to be a ‘necessary evil’ towards achieving tertiary qualifications. Nevertheless, progressive policy recommendations such as direct subsidies to underprivileged students and income-based repayment were strongly supported. At the same time, there appears to be a lack of knowledge on how PTPTN, the biggest loan provider, conducts its borrowings and lendings. These were some key findings, among many others, of our survey which is further detailed below.
About the study
The study was conducted via an online questionnaire, distributed using a convenience sampling method, between 3 August to 17 September 2021. The survey came in both Malay and English versions.
Since the survey’s sampling method was not stratified random sampling, results must be read with that in mind. Based on the profile of our survey respondents, we estimate that our survey respondents skew urban, but are fairly representative of student loan borrowers on other major demographic parameters such as age and gender. However, we acknowledge that this estimation can only be confirmed with access to a student loan database, which is not publicly available.
A total of 356 responses were collected during the study period of which 53 were rejected due to their status as non-borrowers and another two were excluded due to the respondents’ inconsistent or duplicated information, leaving a sample of 301 responses.
55% of the respondents were female. 73% of respondents were between 25-40 years of age, 19% were between 17-24 years old, and 8% were between 41-55 years old. Ethnically, 71% were Malays, followed by 12% Chinese, 9% Indians, and 5% non-Malay Bumiputera. Geographically, 64% of respondents came from Selangor and Kuala Lumpur.
Demographics of Survey Respondents

Employment, income and financial patterns
The majority of respondents are employed in some capacity. 68% of respondents were full-time employees, while 11% were otherwise employed as part-time employees or freelancers or entrepreneurs; 2% were full-time homemakers. Of those not in employment, 7% were unemployed and 12% were still studying. (Figure 1).
Figure 1: Employment status
With respect to current income, after excluding those who identified themselves as still studying, 9% of respondents stated that they have no regular monthly income, 16% earned less than RM2,000 a month, and 36% earned between RM2,000 and RM4,000 a month (Figure 2). Altogether, 61% of respondents earned below RM4,000 a month.
Figure 2: Current monthly income
A majority of respondents, 67%, were early-career employees with 7 years’ or under working experience. 38% of respondents reported working for less than 3 years, 29% reported between 3-7 years, 11% reported 7-10 years, and 22% reported more than 10 years (Figure 3).
Figure 3: Years of working experience
In terms of perceived income growth (again after excluding those who were still studying), we found that 42% of respondents reported steadily increasing income – a noteworthy finding that reflects positively on career progression and the returns to higher education. However, a significant 44% of respondents reported that their income has been somewhat stagnant since they started working. A minority reported worrying income trends: around 10% reported unstable income, 2% reported no income, and 3% reported decreasing income (Figure 4).
Figure 4: Respondents’ income trend
Also noteworthy: 52% of respondents reported that the Covid-19 pandemic had little to no impact to their income, while 13% even saw their income increase during this period. However, among those whose income had been disrupted, the losses were substantial; 8% saw their income decrease by at least 30%, and another 11% reported experiencing a job loss (Figure 5).
Figure 5: Impact of pandemic on income
A small majority of respondents, 54%, have at least one financial dependent such as a non-working spouse, children or parent(s) (Figure 6).
Figure 6: Number of financial dependents
Other than student loans, approximately 67% of borrowers report providing some level of financial support to their parents. 45% have car loans to service, and 30% have credit card debts to pay. 25% have housing loans, and 21% have incurred personal loans (Figure 7).
Figure 7: Type of financial obligations
What they borrowed for, and how much
The vast majority of respondents (74%) took out just one student loan, though a sizable number took out two student loans (25%) and a minority took out three student loans (1%).
Figure 8: Number of educational loans per respondent
The loans were mostly used to fund a bachelor’s degree, followed by pre-u and diploma (Figure 9).
Figure 9: Courses funded by student loans
A majority of respondents studied in public higher education institutions (IPTA) compared to private higher education institutions (IPTS) and overseas institutions. The share of overseas education amongst respondents is higher for post-graduate studies and professional/technical certification (Figure 10).
Figure 10: Type of institution by level of course type
Interestingly, respondents indicated a high completion rate of their study programs. The completion rate for bachelor’s degrees was 88%; only 2% failed to complete their programs while the remaining 10% of respondents were still studying (Figure 11).
Figure 11: Course completion rate
In terms of loan providers, PTPTN was by far the largest source of student loans. 82% of respondents reported borrowing from PTPTN, followed by 14% from MARA and 8% from state governments (Figure 12).
Figure 12: Sources of student loan
In terms of loan amount, 82% borrowed under RM60,000,which is consistent with the average loan size stated by PTPTN’s chairperson. 10% of respondents borrowed less than RM15,000 41% borrowed RM15,001 to RM30,000 while another 31% borrowed RM30,001 to RM60,000; only 7% borrowed more than RM100,000 (Figure 13).
Figure 13: Student loan amount
In terms of the length of time to fully repay their student loans per their loan agreement, 34% stated that they have to pay it off within 5-10 years and another 34% stated they will have to pay it off within 10-20 years. 16% reported they have to pay their debts within 20-30 years and the remaining 8% reported that they will take more than 30 years to pay off their student loan (Figure 14). For the record, PTPTN allows borrowers to restructure their loans which can extend the repayment period until the borrower reaches 60 years of age.
Figure 14a: Student loan tenure
Figure 14b: Student loan tenure by total loan amount
Borrowers’ monthly repayments depend on their loan size and repayment period. A large majority of respondents, 72%, pay between RM100 and RM300 a month. Of these, 8% pay less than RM100 a month, 45% of respondents pay between RM100 and RM200 a month, 27% pay between RM200 and RM300 a month, 11% pay between RM300 and RM400 a month, 5% pay between RM 400 and RM 500 a month, and 4% pay more than RM500 a month (Figure 15).
Figure 15: Monthly loan repayment amount
When borrowers’ income is commensurate with their monthly repayment and debt amount, student debt is less of a problem. Except for those who reported having no monthly income currently, monthly repayments are generally consistent with borrowers’ income level, i.e. borrowers with higher monthly loan instalments tend to earn at higher levels (Figure 16). There is however a segment of graduates earning less than RM2,000 or with no income that face considerable monthly repayments. In the highest income group, curiously 38% of those earning more than RM7,000 were paying RM200 or below in monthly repayments – another argument perhaps for setting repayment amounts based on income.
Figure 16: Monthly loan repayment by respondents’ income
41% of respondents have negotiated to restructure their loan repayment at least once – a surprisingly high number. The greater the loan size, the more likely that borrowers will restructure their loan repayment. Roughly 75% of respondents who borrowed more than RM100,000 restructured their loan repayment, followed by 46% of those who borrowed between RM60,001 to RM100,000, 40% of those who borrowed between RM30,001 to RM60,000, 40% of those borrowed between RM15,001 to RM30,000, and only 20% among those who borrowed less than RM15,000 (Figure 17).
Figure 17: Loan restructuring by loan size
In terms of their income, surprisingly, there were more respondents who restructured their loans amongst the highest income group (49% amongst those making greater than RM7,000 a month) compared to the lowest income group (26% amongst those making less than RM2,000 a month) (Figure 18)*. This may be attributed to two possible reasons: those who have higher income could perhaps afford to take advantage of PTPTN discounts for large sum repayments and so could restructure to settle their loans quicker, while those who have the least income defaulted rather than restructured their loans.
*This pattern holds even when we compare the second highest income group and the second lowest income group. The exception is those who reported no monthly income – about 50% of them restructured their loans.
Figure 18: Loan restructuring by respondents’ income
In terms of repayment rate, which has been a thorny issue generating sharply divergent headlines, our survey mostly corroborated PTPTN’s statements: while a small minority defaults, a majority of borrowers do repay their loans. 60% of respondents can be categorised as having good standing in that they have either completely repaid their loans or are paying as scheduled. 20% can be categorised as inconsistent payers and 8% can be categorised as hardcore defaulters who never repay their loans. 12% of respondents were not yet scheduled to begin repayment (Figure 19).
Figure 19: Repayment status amongst respondents
Taking a closer look into defaulting patterns, our findings are largely confirmed by PTPTN’s own survey (mentioned in this publication here) that defaulters tend to come from low-income groups. For those who made inconsistent payments, 46% of them reported having no current income or earned less than RM2,000 a month and another 29% earned between RM2,000 and RM4,000. For those who never made repayment, 36% of them reported no monthly income currently and another 32% earned less than RM2,000. Nevertheless, there is a sizable percentage of those making inconsistent payments from high income groups: 14% of them earned between RM4,000 and RM7,000, and another 12% of them earned more than RM7,000 a month (Figure 20).
Figure 20: Repayment status by respondents’ income
To better understand motivations behind paying or not paying off student loans, we asked respondents to check a list of statements that explain their actions. The top three reported reasons why borrowers of good standing pay their loans are: they feel responsible for what they owe (94%), they do not like to be in debt (93%), and they want to avoid penalties (87%) (Figure 21).
Figure 21: Motivations for consistent repayment
Among those who did not pay or were paying inconsistently, the top three reported reasons for their payment behaviour were: they do not have enough to cover their cost of living (75%), they were waiting for announcement or election promises to discount their student loan (73%), and they believe it is unfair to have to pay this much for their education (71%) (Figure 22).
Figure 22: Motivations for inconsistent payment/defaulting
First Generation Student Loan Borrowers vs. The Rest
59% of respondents identified as first-generation tertiary graduates (‘first gens’), meaning that neither parent possesses a university degree. While this testifies to the benefit of student loans in enabling first gens to pursue higher education, they also appear to earn lower incomes, as a group, compared to borrowers with parents that have higher education qualifications.
There was a higher proportion of first-gens earning below RM2,000 (20%) compared to non first-gen respondents (11%). There were also more first-gens who reported having no monthly income currently compared to non first-gen respondents. Bottom line: even though attaining higher education is important, parents’ educational qualifications are also a determinant to a borrowers’ earning capability.
Figure 23: Income of first generation borrowers versus others
Impact of, and Perception on, Student Loans
In addition to their profiles and borrowing, we also asked respondents how they perceived the worth of student loans, the impact of student loans on their finances, and whether today’s student loan policies should be continued or reformed.
When we asked respondents if they felt that the education or qualification that they received was worth their student loans, a majority of 59% reported that it is worth it (Figure 24). Roughly 22% reported feeling neutral and the remaining 20% indicated that it was not worth it.
Figure 24: Perception of education’s worth compared to student loan
When we examined the data according to income, unsurprisingly we found that those who earned less are more likely to report that their higher education is not worth the loan compared to those who earned more. Borrowers who earned less than RM2,000 a month or had no monthly income currently were more likely to report that their education is not worth the student debt incurred compare to respondents earning at higher levels (Figure 25).
Figure 25: Perception of education’s worth by respondents’ income
When we compare perception of education’s worth by the types of institutions for bachelor’s degree – the most popular course amongst our respondents – we found that those in local public higher education institutions (IPTA) are more likely to report that their education is worth the loan compared to their peers in local private higher education institutions (IPTS). The latter was also slightly more likely to express that their education is not worth the loan. Also noteworthy: those who studied in overseas higher education institutions were more strongly inclined to report that their education is worth the loan compared to those from local higher education institutions.
Figure 26: Perception of education’s worth by type of educational institution (degrees only)
Somewhat surprisingly, relatively few respondents reported experiencing loan penalties (Figure 27). Only 11% said they experienced being unable to travel due to immigration blacklists for not repaying their student loan. 4% reported being sued for not repaying student loans, and another 2% reported that they declared court bankruptcy for not repaying their student loans. 24% reported difficulties in getting a bank loan because of their student loan repayment status affecting their creditworthiness scores.
Figure 27: Penalties faced by loan borrowers
To better understand the different ways student debt affects borrowers’ lives, we asked respondents about the impact of student loans on their finances and life plans. 59% reported that student loans contributed to financial stress, 57% reported that student loans contributed to a delay in purchasing a home, and 52% reported that student loans contributed to them postponing savings, including emergency savings and retirement savings (Figure 28). 46% of respondents reported that student loans have contributed to them not starting a business or pursuing risky ventures, while 42% reported that student loans have contributed to them delaying marriage or having kids.
Figure 28: Effect of student loans on life choices
We also asked respondents what they think of some ideas to reform student loan policies. Income was a strong theme. 82% of respondents agreed that student debt is not a problem if graduates earn higher wages. Relatedly, there is strong support from respondents, 81%, to only begin student loan repayments after reaching an affordable level of income, a policy which we advocated in Part 2 of this research series. More than two-thirds of respondents, 77%, agree that underprivileged and overburdened borrowers should have part of their student loan forgiven, a proposal that we also pushed for.
Figure 29: Support for income-based repayment and partial loan cancellation
Policy ideas to impose more restrictions on student loans did not resonate with the respondents, going against our policy recommendations in this area. A majority of respondents disagree that criteria for student loans should be tightened and given for certain courses only (69%) or certain institutions only (71%), which were two of the policy recommendations we advocated in Part 3 of this research series. A small majority of respondents also reacted negatively to our policy recommendation that there should be less student loans for university degrees, and more for technical and online courses including micro-credentials (52% disagreed). That said, further studies that include a more representative sample, including more of TVET graduates, may present findings that are less skewed towards university degrees.
Figure 30: Support for loan reform proposals
77% of respondents agree that youth should not need to get into debt to attain higher education, and an even bigger majority, 82%, said the poor should not have to do so. A majority of respondents, 59%, disagreed with the statement that an individual person or family is fully responsible to save up and pay for their own higher education. Given these numbers, we would be interested to see if borrowers feel that the family should be partially responsible for paying the costs of higher education – perhaps in a future study.
Figure 31: Views on higher education financing
On the question of fiscal affordability, about two-thirds of respondents, 69%, think the country can afford to make higher education free for everyone, which in our view reflects the gulf between policymakers (who tend to be more fiscally mindful/conservative) with the general public.
Figure 32: Views on affordability of free higher education
However, many respondents were not aware of how PTPTN – the biggest loan provider – operates (Figure 33). Only 39% were aware that PTPTN borrows from financial institutions and markets. More than two-thirds of respondents, 77%, thought that PTPTN is completely funded by the government and taxpayers, and only 36% were aware that the Malaysian government guarantees PTPTN’s debts. About 40% thought that PTPTN is completely funded by the ongoing collection of outstanding loans. (We covered how PTPTN operates in Part 1).
Figure 33: Knowledge of PTPTN’s funding base
Conclusion
We began this research series by outlining the major problems with student loans as the main policy approach to finance one’s higher education. As have been pointed out elsewhere, a major issue is the uneven returns from higher education. This is borne out by our survey where less than half of respondents are earning RM4,000 a month and above.
Due to uneven returns from higher education, we hypothesised that graduates are questioning the worth of their tertiary education relative to their loans. This was somewhat supported by the survey, where a small majority of respondents, 59%, agreed that their education was worth the loans incurred. Borrowers whose income is lower than RM2,000 a month were especially likely to question the worth of their tertiary education.
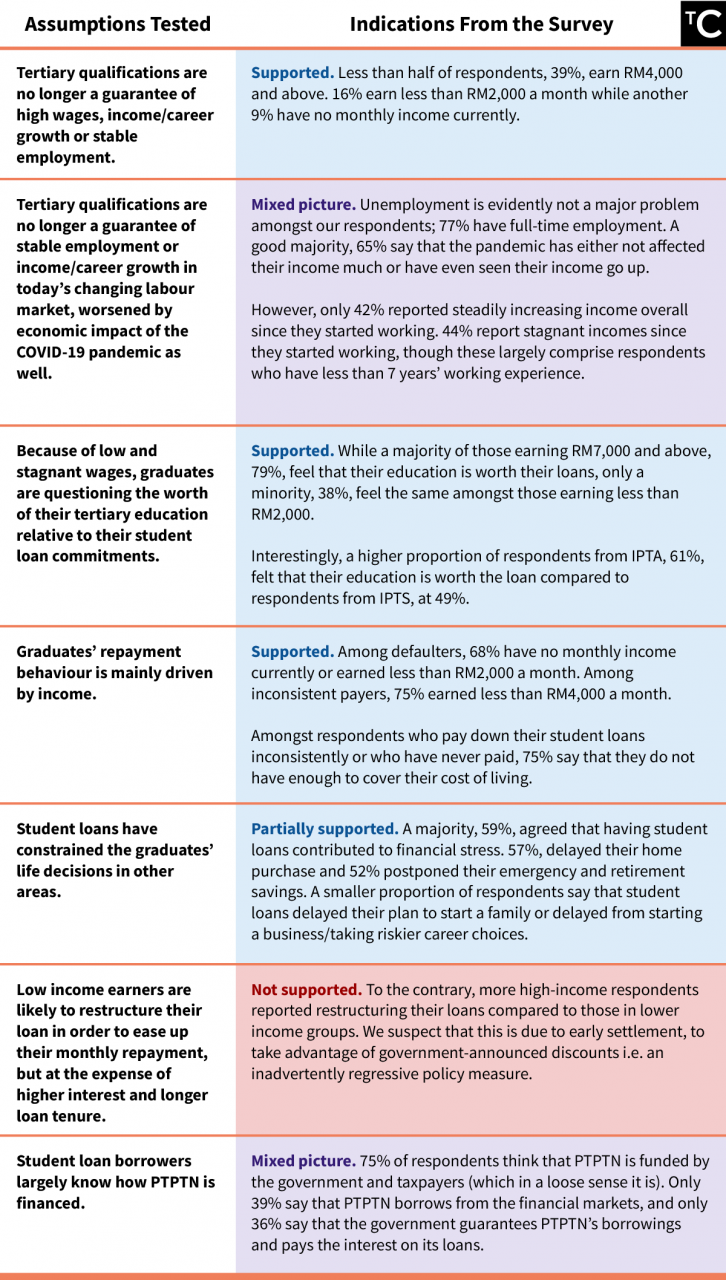
We tested our other assumptions on related facets such as payment behaviour, level of loan restructuring, how student loans affect stress and life plans as well as the extent of knowledge on how PTPTN is financed; these are summarised in Table 1 below. While we were mostly validated regarding the effects of income on some of these hypotheses, some results were less negative/severe than we expected.
Table 1: Assumptions tested and indications from the survey
Apart from the assumptions above, we also tested our policy perspectives against borrowers’ views via the survey (Table 2). Some of our policy recommendations did not find favour. In Part 3, we had advocated to tighten conditions and limit student loans to certain courses or institutions with proven track records, but respondents rejected this proposal by a huge margin. We had also advocated to extend more student loans for technical and vocational (TVET) and microcredit courses but respondents were not enthusiastic about reducing loans for traditional degrees in favour of funding more TVET and microcredit courses.
However, other proposals evidently struck a chord among the respondents. There was strong endorsement to permit borrowers to begin repayment only after they reached an affordable level of income i.e. income-based repayment. Respondents also supported our policy view that lower income households should not have to incur debt to attain higher education, suggesting an appetite for progressive reforms. Our policy recommendations that align with such a vision include providing targeted and partial student loan cancellation for low income borrowers as well as direct subsidies, rather than loans, to low-income students.
Table 2: Support for our loan policy recommendations

In essence, decisions on how to improve today’s educational financing policy ought to be shaped by two key drivers: the real returns of higher education and the sustainability of PTPTN’s funding structure.
Acknowledging and identifying the unevenness of returns from higher education would help to set the path towards policies that (i) really help to level the playing field for low-income households/students, and (ii) puts the right level of funding and quality assurance support in non-traditional forms of higher or continuing education such as TVET and microcredentials.
Acknowledging the (lack of) long-term sustainability of PTPTN’s funding structure would help to set the path towards policies that (iii) moves away from debt towards further supporting/subsidising the behaviour of early saving for every Malaysian’s lifelong education, and (iv) institutionalises greater transparency, accountability and oversight in funding bodies such as PTPTN.
Given the changes occurring in employment and higher education, we believe that the time is ripe for more evidence-based policymaking and research-led inquiry on student loans as a policy instrument, as well as alternative paths forward. With the General Election in Malaysia’s imminent future, we look forward to seeing and contrasting the range of policy proposals from the nation’s major political parties on this highly important topic.
Related Articles
")
Generasi Berhutang
Bahagian 1: Kebingungan Hutang Pendidikan Tinggi di Malaysia
Bagi generasi muda di Malaysia, pendidikan tinggi lazimnya dibiayai melalui pinjaman pendidikan. Adakah pendekatan ini wajar diteruskan? Siri penyelidikan ini meneliti permasalahan ini serta merenungi beberapa cadangan dasar untuk masa hadapan.

Generasi Berhutang, Bahagian 3
Daripada Pinjaman Pendidikan kepada Akaun Pembelajaran Sepanjang Hayat
Untuk mengurangkan kebergantungan pada pinjaman pendidikan, kami cadangkan kita beralih kepada kaedah pembiayaan yang berasaskan pembelajaran berterusan.

Stories from an Indebted Generation
In our four-part research series, we wrote about the burden borrowers carry from student loan debt. Now, we present, in their own words, the impact of student loans on their lives.
The Centre is a centrist think tank driven by research and advocacy of progressive and pragmatic policy ideas. We are a not-for-profit and a mostly remote working organisation.